

Get bondgraph#
Extracting the covalent bond graph of a molecular system.
The function molsysmt.topology.get_bondgraph() extracts the network graph of covalent bonds where atoms represent nodes and covalent bonds represent edges.
Added in version 1.0.0.
API documentation
Follow this link for a detailed description of the input arguments, raised errors, and returned objects of this function: molsysmt.topology.get_bondgraph().
Basic usage#
Let’s show how to extract a network graph representation of covalent bonds for Met-enkephalin:
import molsysmt as msm
import networkx as nx
import matplotlib.pyplot as plt
molsys = msm.convert(msm.systems['Met-enkephalin']['met_enkephalin.h5msm'])
Note
Demo Systems Catalog
This tutorial uses demonstration datasets provided by MolSysMT. To explore the full catalog of bundled systems, forms, and file paths, visit the Demo Systems guide.
We extract the bond graph as a NetworkX graph using molsysmt.topology.get_bondgraph():
graph = msm.topology.get_bondgraph(molsys, to_form='networkx.Graph')
n_nodes = graph.number_of_nodes()
n_edges = graph.number_of_edges()
print(f'The graph has {n_nodes} nodes and {n_edges} edges.')
The graph has 72 nodes and 73 edges.
Visualizing the 2D bond graph#
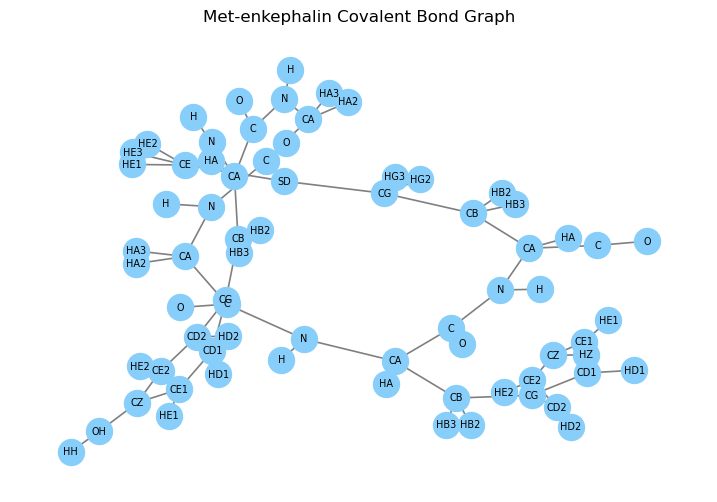
We can render the 2D topology graph using NetworkX and Matplotlib, labeling nodes with their atom names:
atom_names = msm.get(molsys, element='atom', name=True)
labels = {i: atom_names[i] for i in range(len(atom_names))}

plt.figure(figsize=(9, 6))
pos = nx.spring_layout(graph, seed=42)
nx.draw_networkx_nodes(graph, pos, node_color='lightskyblue', node_size=350)
nx.draw_networkx_edges(graph, pos, edge_color='gray', width=1.2)
nx.draw_networkx_labels(graph, pos, labels=labels, font_size=7)
plt.title('Met-enkephalin Covalent Bond Graph')
plt.axis('off')
plt.show()
Connected components analysis#
We can compute the number of connected covalent components using NetworkX functions:
components = list(nx.connected_components(graph))
print(f'Number of connected covalent components: {len(components)}')
Number of connected covalent components: 1
See also
Related Tools & References
Convert: Convert molecular systems between different forms with
molsysmt.basic.convert().Get: Query atom and bond properties with
molsysmt.basic.get().Get covalent blocks: Partition molecular systems into disconnected covalent blocks with
molsysmt.topology.get_covalent_blocks().Get covalent paths: Search for covalent bond chains matching sequence patterns with
molsysmt.topology.get_covalent_paths().