

Get radius of gyration#
Computing the radius of gyration of a molecular system.
The function molsysmt.structure.get_radius_of_gyration() measures the spatial distribution of atoms around their center of mass or geometric center, quantifying overall macromolecular compactness and shape fluctuations.
Added in version 1.0.0.
API documentation
Follow this link for a detailed description of the input arguments, raised errors, and returned objects of this function: molsysmt.structure.get_radius_of_gyration().
Basic usage#
Let’s show how to calculate the geometric radius of gyration over a pentalanine trajectory:
import molsysmt as msm
import matplotlib.pyplot as plt
import pyunitwizard as puw
molsys = msm.convert(msm.systems['pentalanine']['traj_pentalanine.h5msm'])
Note
Demo Systems Catalog
This tutorial uses demonstration datasets provided by MolSysMT. To explore the full catalog of bundled systems, forms, and file paths, visit the Demo Systems guide.
We calculate the geometric radius of gyration over all heavy atoms using molsysmt.structure.get_radius_of_gyration():
rg_geom = msm.structure.get_radius_of_gyration(molsys, selection='atom_type!="H"')
print('Radius of gyration shape:', rg_geom.shape)
print(f'Mean geometric Rg: {rg_geom.mean():.3f}')
Radius of gyration shape: (5000,)
Mean geometric Rg: 0.515 nanometer
Mass-weighted radius of gyration#
Passing weights='masses' calculates the physical, mass-weighted radius of gyration around the center of mass:
rg_mass = msm.structure.get_radius_of_gyration(molsys, selection='atom_type!="H"', weights='masses')
print(f'Mean mass-weighted Rg: {rg_mass.mean():.3f}')
Mean mass-weighted Rg: 0.514 nanometer
Radius of gyration evolution across structural ensembles#
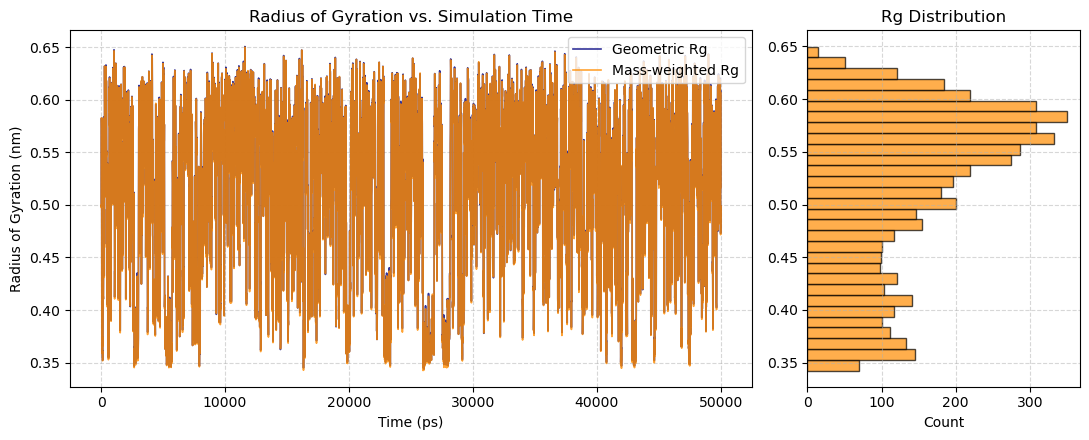
We plot the time series and distribution of the radius of gyration to observe conformational transitions between compact and extended states:
time = msm.get(molsys, element='system', time=True)
time_val = puw.get_value(time, to_unit='ps')
rg_geom_val = puw.get_value(rg_geom, to_unit='nm')
rg_mass_val = puw.get_value(rg_mass, to_unit='nm')

fig, (ax1, ax2) = plt.subplots(1, 2, figsize=(11, 4.5), gridspec_kw={'width_ratios': [2.5, 1]})

# Time series
ax1.plot(time_val, rg_geom_val, label='Geometric Rg', color='navy', lw=1.2, alpha=0.8)
ax1.plot(time_val, rg_mass_val, label='Mass-weighted Rg', color='darkorange', lw=1.2, alpha=0.8)
ax1.set_xlabel('Time (ps)')
ax1.set_ylabel('Radius of Gyration (nm)')
ax1.set_title('Radius of Gyration vs. Simulation Time')
ax1.grid(True, linestyle='--', alpha=0.5)
ax1.legend()

# Histogram distribution
ax2.hist(rg_mass_val, bins=30, orientation='horizontal', color='darkorange', alpha=0.7, edgecolor='black')
ax2.set_xlabel('Count')
ax2.set_title('Rg Distribution')
ax2.grid(True, linestyle='--', alpha=0.5)

plt.tight_layout()
plt.show()
See also
Related Tools & References
Convert: Convert molecular systems between different forms with
molsysmt.basic.convert().Get: Query system time and structural attributes with
molsysmt.basic.get().Get center: Compute the geometric center or center of mass with
molsysmt.structure.get_center().Get principal axes: Compute the principal axes and moments of inertia with
molsysmt.structure.get_principal_axes().Get RMSD: Compute root-mean-square deviations with
molsysmt.structure.get_rmsd().