

Least RMSD fit#
Superposing a molecular system onto a reference structure using the Kabsch algorithm.
The function molsysmt.structure.least_rmsd_fit() rotates and translates a molecular system (or every frame of a trajectory) to minimize the root-mean-square deviation of a chosen atom selection relative to a reference structure.
Added in version 1.0.0.
API documentation
Follow this link for a detailed description of the input arguments, raised errors, and returned objects of this function: molsysmt.structure.least_rmsd_fit().
Basic usage#
Let’s show how to fit all frames of a pentalanine trajectory onto its initial frame using backbone atoms:
import molsysmt as msm
import matplotlib.pyplot as plt
import pyunitwizard as puw
molsys = msm.convert(msm.systems['pentalanine']['traj_pentalanine.h5msm'])
Note
Demo Systems Catalog
This tutorial uses demonstration datasets provided by MolSysMT. To explore the full catalog of bundled systems, forms, and file paths, visit the Demo Systems guide.
We fit the trajectory using molsysmt.structure.least_rmsd_fit() specifying selection_fit='backbone':
molsys_fitted = msm.structure.least_rmsd_fit(molsys, selection='all', selection_fit='backbone', reference_structure_index=0)
Verifying alignment with get_rmsd#
When we compute the raw unaligned RMSD on molsys_fitted, it precisely matches the theoretical minimum RMSD computed by get_least_rmsd:
rmsd_fitted = msm.structure.get_rmsd(molsys_fitted, selection='backbone', reference_structure_index=0)
rmsd_least = msm.structure.get_least_rmsd(molsys, selection='backbone', reference_structure_index=0)

print(f'Fitted RMSD at frame 1: {rmsd_fitted[1]:.4f}')
print(f'Theoretical Least RMSD at frame 1: {rmsd_least[1]:.4f}')
Fitted RMSD at frame 1: 0.1259 nanometer
Theoretical Least RMSD at frame 1: 0.1259 nanometer
RMSD evolution of fitted structural ensembles#
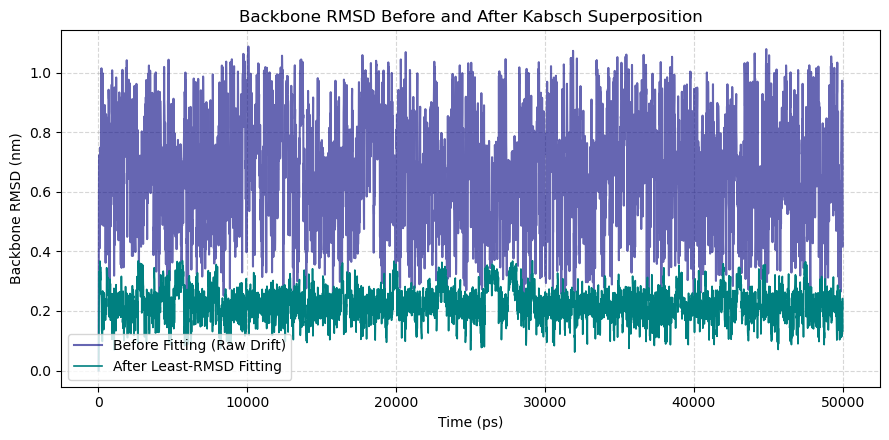
We plot the RMSD time series before and after least-RMSD fitting to visualize the removal of rotational and translational drift:
time = msm.get(molsys, element='system', time=True)
time_val = puw.get_value(time, to_unit='ps')
rmsd_raw = msm.structure.get_rmsd(molsys, selection='backbone', reference_structure_index=0)

plt.figure(figsize=(9, 4.5))
plt.plot(time_val, puw.get_value(rmsd_raw, to_unit='nm'), color='navy', alpha=0.6, label='Before Fitting (Raw Drift)')
plt.plot(time_val, puw.get_value(rmsd_fitted, to_unit='nm'), color='teal', lw=1.2, label='After Least-RMSD Fitting')
plt.xlabel('Time (ps)')
plt.ylabel('Backbone RMSD (nm)')
plt.title('Backbone RMSD Before and After Kabsch Superposition')
plt.grid(True, linestyle='--', alpha=0.5)
plt.legend()
plt.tight_layout()
plt.show()
See also
Related Tools & References
Convert: Convert molecular systems between different forms with
molsysmt.basic.convert().Get: Query system time and structural attributes with
molsysmt.basic.get().Get RMSD: Compute unaligned root-mean-square deviations with
molsysmt.structure.get_rmsd().Get least RMSD: Calculate optimal superposition RMSD values with
molsysmt.structure.get_least_rmsd().Least RMSD align: Sequence-guided alignment for disparate topologies with
molsysmt.structure.least_rmsd_align().