

Get RMSF#
Calculating root-mean-square fluctuations per atom over a trajectory.
The function molsysmt.structure.get_rmsf() computes the root-mean-square fluctuation (RMSF) of each atom around its time-averaged spatial position across a trajectory or structural ensemble.
Added in version 1.0.0.
API documentation
Follow this link for a detailed description of the input arguments, raised errors, and returned objects of this function: molsysmt.structure.get_rmsf().
Basic usage#
Let’s show how to calculate atomic fluctuations over a pentalanine simulation (first superposing all frames onto the reference frame to isolate pure internal flexibility from rigid-body tumbling):
import molsysmt as msm
import matplotlib.pyplot as plt
import pyunitwizard as puw
import numpy as np
molsys = msm.convert(msm.systems['pentalanine']['traj_pentalanine.h5msm'])
molsys_fitted = msm.structure.least_rmsd_fit(molsys, selection='all', selection_fit='backbone', reference_structure_index=0)
Note
Demo Systems Catalog
This tutorial uses demonstration datasets provided by MolSysMT. To explore the full catalog of bundled systems, forms, and file paths, visit the Demo Systems guide.
We calculate the RMSF across all atoms using molsysmt.structure.get_rmsf():
rmsf_all = msm.structure.get_rmsf(molsys_fitted, selection='all')
print('RMSF array shape:', rmsf_all.shape)
print(f'Average RMSF over all atoms: {rmsf_all.mean():.4f}')
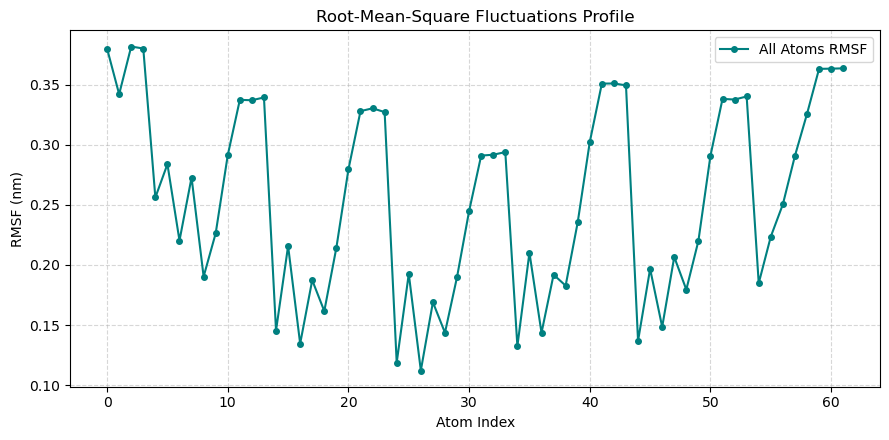
RMSF array shape: (62,)
Average RMSF over all atoms: 0.2551 nanometer
Plotting per-atom fluctuation profile#
We plot the RMSF profile along all atom indices to identify regions of elevated atomic flexibility:
rmsf_val = puw.get_value(rmsf_all, to_unit='nm')

plt.figure(figsize=(9, 4.5))
plt.plot(range(len(rmsf_val)), rmsf_val, marker='o', color='teal', lw=1.5, markersize=4, label='All Atoms RMSF')
plt.xlabel('Atom Index')
plt.ylabel('RMSF (nm)')
plt.title('Root-Mean-Square Fluctuations Profile')
plt.grid(True, linestyle='--', alpha=0.5)
plt.legend()
plt.tight_layout()
plt.show()
Per-residue fluctuation analysis#
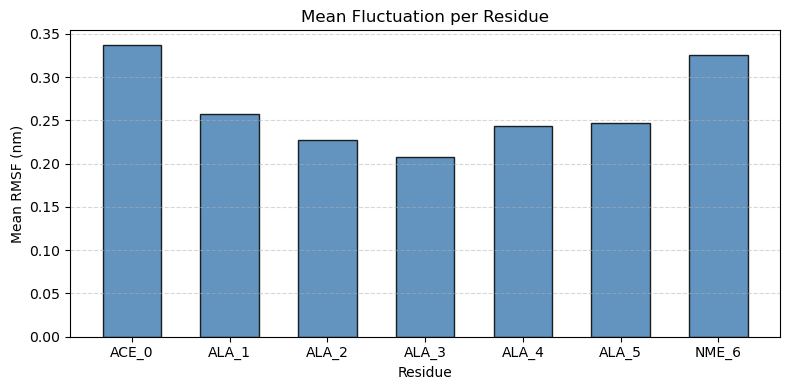
We can compute the average fluctuation for each residue group to assess backbone and sidechain mobility by residue:
groups = msm.get(molsys, element='group', atom_index=True)
group_names = msm.get(molsys, element='group', name=True)
res_rmsf = [np.mean(rmsf_val[atom_idx]) for atom_idx in groups]

plt.figure(figsize=(8, 4))
plt.bar(range(len(res_rmsf)), res_rmsf, color='steelblue', edgecolor='black', alpha=0.85, width=0.6)
plt.xticks(range(len(res_rmsf)), [f'{name}_{i}' for i, name in enumerate(group_names)])
plt.xlabel('Residue')
plt.ylabel('Mean RMSF (nm)')
plt.title('Mean Fluctuation per Residue')
plt.grid(axis='y', linestyle='--', alpha=0.5)
plt.tight_layout()
plt.show()
See also
Related Tools & References
Convert: Convert molecular systems between different forms with
molsysmt.basic.convert().Least RMSD fit: Superpose trajectory frames to remove rigid-body tumbling with
molsysmt.structure.least_rmsd_fit().Get RMSD: Compute root-mean-square deviations with
molsysmt.structure.get_rmsd().Get radius of gyration: Measure conformational compactness with
molsysmt.structure.get_radius_of_gyration().Principal Component Analysis: Identify principal modes of collective motion with
molsysmt.structure.principal_component_analysis().