

Get secondary structure#
Assigning secondary structure per residue using DSSP rules.
The function molsysmt.structure.get_secondary_structure() assigns secondary structure categories (such as \(\alpha\)-helices, \(\beta\)-strands, and coils) to amino acid residues across single structures or simulation trajectories using the DSSP algorithm.
Added in version 1.0.0.
API documentation
Follow this link for a detailed description of the input arguments, raised errors, and returned objects of this function: molsysmt.structure.get_secondary_structure().
Basic usage#
Let’s show how to assign 3-state secondary structure categories for TcTIM (PDB ID: 1TCD):
import molsysmt as msm
import matplotlib.pyplot as plt
import numpy as np
molsys = msm.convert(msm.systems['TcTIM']['1tcd.h5msm'])
Note
Demo Systems Catalog
This tutorial uses demonstration datasets provided by MolSysMT. To explore the full catalog of bundled systems, forms, and file paths, visit the Demo Systems guide.
By default, molsysmt.structure.get_secondary_structure() uses the simplified 3-state classification: 'H' (helix), 'E' (extended strand), and 'C' (coil/loop):
ss_3state = msm.structure.get_secondary_structure(molsys, simplified=True)
print('Secondary structure array shape:', ss_3state.shape)
print('First 25 residue assignments:', ss_3state[0, :25])
Secondary structure array shape: (1, 662)
First 25 residue assignments: ['C' 'C' 'C' 'C' 'E' 'E' 'E' 'E' 'E' 'C' 'C' 'E' 'C' 'C' 'C' 'H' 'H' 'H'
 'H' 'H' 'H' 'H' 'H' 'H' 'H']
Full 8-state DSSP assignment#
Setting simplified=False returns the detailed 8-category DSSP classification ('H', 'B', 'E', 'G', 'I', 'T', 'S', ' '):
ss_8state = msm.structure.get_secondary_structure(molsys, simplified=False)
print('First 25 residues in 8-state classification:', ss_8state[0, :25])
First 25 residues in 8-state classification: [' ' ' ' ' ' ' ' 'E' 'E' 'E' 'E' 'E' ' ' ' ' 'B' ' ' ' ' ' ' 'H' 'H' 'H'
 'H' 'H' 'H' 'H' 'H' 'H' 'H']
Visualizing secondary structure composition#
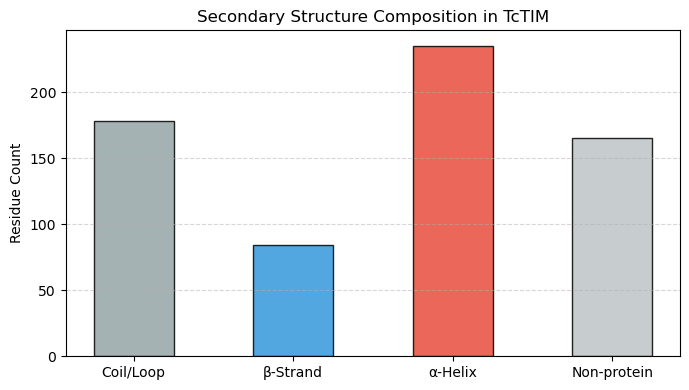
We plot the overall secondary structure composition across the protein:
unique_states, counts = np.unique(ss_3state[0], return_counts=True)
state_labels = {'H': 'α-Helix', 'E': 'β-Strand', 'C': 'Coil/Loop', 'NA': 'Non-protein'}
labels = [state_labels.get(s, s) for s in unique_states]
colors = {'H': '#e74c3c', 'E': '#3498db', 'C': '#95a5a6', 'NA': '#bdc3c7'}
bar_colors = [colors.get(s, '#7f8c8d') for s in unique_states]

plt.figure(figsize=(7, 4))
plt.bar(labels, counts, color=bar_colors, edgecolor='black', alpha=0.85, width=0.5)
plt.ylabel('Residue Count')
plt.title('Secondary Structure Composition in TcTIM')
plt.grid(axis='y', linestyle='--', alpha=0.5)
plt.tight_layout()
plt.show()
See also
Related Tools & References
Convert: Convert molecular systems between different forms with
molsysmt.basic.convert().Select: Select specific residues and atom groups with
molsysmt.basic.select().Get dihedral angles: Compute backbone Ramachandran angles with
molsysmt.structure.get_dihedral_angles().Get sequence alignment: Align amino acid sequences with
molsysmt.topology.get_sequence_alignment().