

Get non-bonded potential energy#
Calculating non-bonded (electrostatic and van der Waals) interaction energies between selections.
The function molsysmt.molecular_mechanics.get_non_bonded_potential_energy() computes non-bonded interaction energies across molecular interfaces or evaluates residue-by-residue interaction energy matrices.
Added in version 1.0.0.
API documentation
Follow this link for a detailed description of the input arguments, raised errors, and returned objects of this function: molsysmt.molecular_mechanics.get_non_bonded_potential_energy().
Note
Molecular Mechanics Backend Engine
Molecular mechanics and force evaluations in MolSysMT are executed using backend simulation engines (currently OpenMM by default). MolSysMT intentionally unifies the Pythonic interface and data structures while delegating energy evaluations, parameterizations, and gradient calculations to high-performance, battle-tested molecular simulation engines.
Basic usage#
Let’s compute the non-bonded interaction energy across a protein–protein complex interface:
import molsysmt as msm
import pyunitwizard as puw
import matplotlib.pyplot as plt
import numpy as np
molsys = msm.convert(msm.systems['Barnase-Barstar']['barnase_barstar.h5msm'])
Note
Demo Systems Catalog
This tutorial uses demonstration datasets provided by MolSysMT. To explore the full catalog of bundled systems, forms, and file paths, visit the Demo Systems guide.
We calculate the total non-bonded interaction energy between Barnase and Barstar:
u_nb = msm.molecular_mechanics.get_non_bonded_potential_energy(molsys,
                                                              selection='molecule_name=="BARNASE"',
                                                              selection_2='molecule_name=="BARSTAR"')
print('Total non-bonded interaction energy:', u_nb)
Total non-bonded interaction energy: -3162.292497634964 kilojoule / mole
Pairwise interaction energy matrix between atom sets#
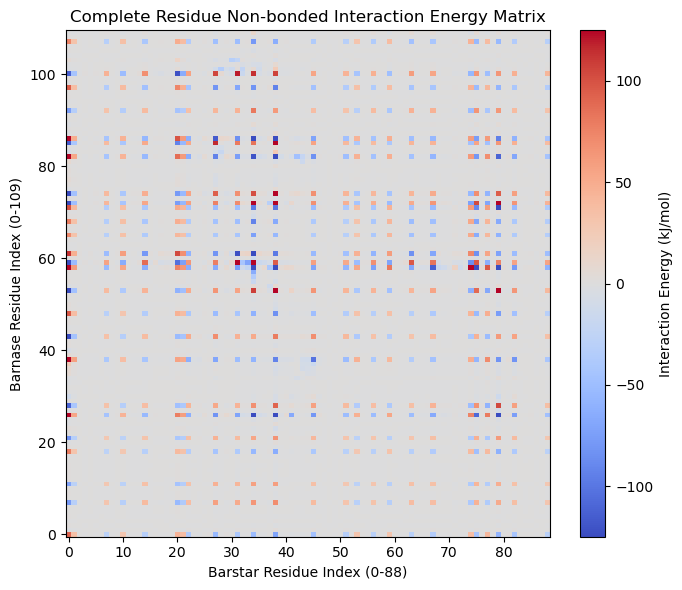
Passing lists of atom selections computes the complete pairwise interaction energy matrix. Here we evaluate the full residue-by-residue interaction matrix between all 110 residues of Barnase and all 89 residues of Barstar:
barnase_groups = [msm.select(molsys, selection=f'molecule_name=="BARNASE" and group_index=={ii}') for ii in range(110)]
barstar_groups = [msm.select(molsys, selection=f'molecule_name=="BARSTAR" and group_index=={jj}') for jj in range(110, 199)]

u_matrix = msm.molecular_mechanics.get_non_bonded_potential_energy(molsys, selection=barnase_groups, selection_2=barstar_groups)
u_vals = puw.get_value(u_matrix, to_unit='kJ/mol')

fig, ax = plt.subplots(figsize=(7, 6))
im = ax.imshow(u_vals, origin='lower', cmap='coolwarm', vmin=-125, vmax=125, aspect='auto')
cbar = plt.colorbar(im, ax=ax)
cbar.set_label('Interaction Energy (kJ/mol)')
ax.set_title('Complete Residue Non-bonded Interaction Energy Matrix')
ax.set_xlabel('Barstar Residue Index (0-88)')
ax.set_ylabel('Barnase Residue Index (0-109)')
plt.tight_layout()
plt.show()
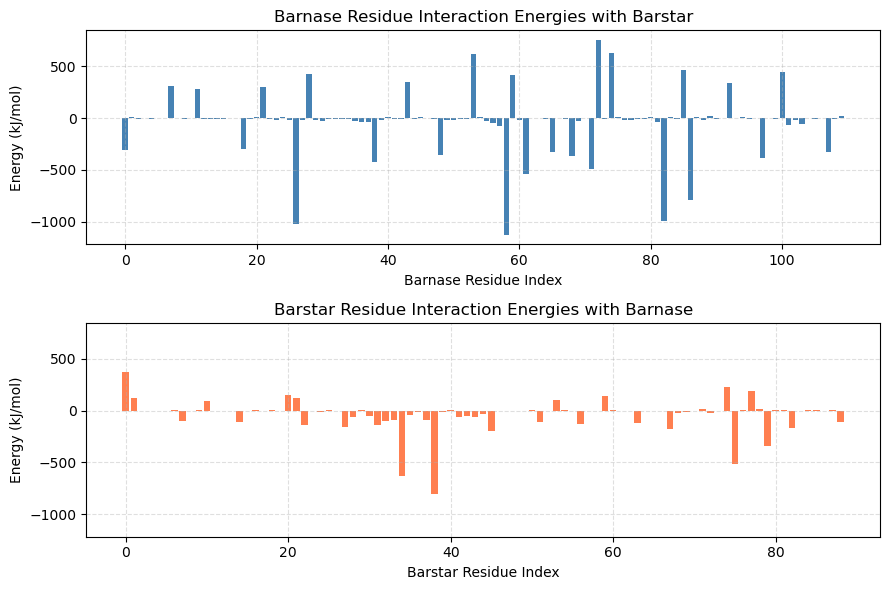
We can also analyze the net non-bonded interaction contribution per residue for each protein:
u_barnase_res = puw.get_value(u_matrix.sum(axis=1), to_unit='kJ/mol')
u_barstar_res = puw.get_value(u_matrix.sum(axis=0), to_unit='kJ/mol')

fig, (ax1, ax2) = plt.subplots(2, 1, figsize=(9, 6), sharey=True)
ax1.bar(range(len(u_barnase_res)), u_barnase_res, color='steelblue')
ax1.set_title('Barnase Residue Interaction Energies with Barstar')
ax1.set_xlabel('Barnase Residue Index')
ax1.set_ylabel('Energy (kJ/mol)')
ax1.grid(True, linestyle='--', alpha=0.4)

ax2.bar(range(len(u_barstar_res)), u_barstar_res, color='coral')
ax2.set_title('Barstar Residue Interaction Energies with Barnase')
ax2.set_xlabel('Barstar Residue Index')
ax2.set_ylabel('Energy (kJ/mol)')
ax2.grid(True, linestyle='--', alpha=0.4)
plt.tight_layout()
plt.show()
Visualizing residue interaction energies in 3D#
We project the net non-bonded interaction energy onto each residue in 3D:
# all_res_vals = list(u_barnase_res) + list(u_barstar_res)
# view = msm.view(molsys)
# view.whole.set_color_by_values(all_res_vals, element='group', palette='coolwarm')
# view
See also
Related Tools & References
Convert: Convert molecular systems with
molsysmt.basic.convert().Select: Query atom selections with
molsysmt.basic.select().Get potential energy: Calculate total potential energy with
molsysmt.molecular_mechanics.get_potential_energy().