%load_ext autoreload
%autoreload 2
import molsysmt as msm
from matplotlib import pyplot as plt
Get SASA#
molecular_system = msm.convert('1tcd')
molecular_system = msm.remove(molecular_system, selection='molecule_type==["water", "ion", "cosolute"]')
msm.info(molecular_system)
| form | n_atoms | n_groups | n_components | n_chains | n_molecules | n_entities | n_proteins | n_structures |
|---|---|---|---|---|---|---|---|---|
| molsysmt.MolSys | 3818 | 497 | 2 | 2 | 2 | 1 | 2 | 1 |
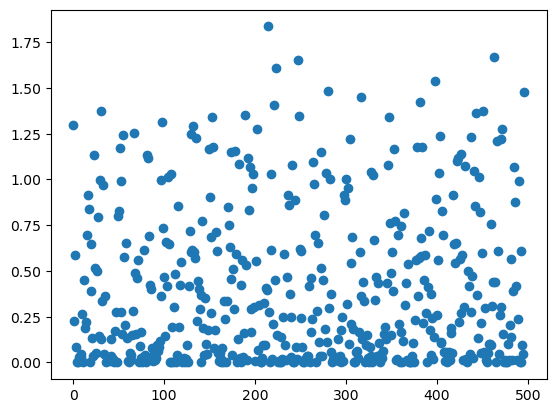
sasa_per_residue = msm.physchem.get_sasa(molecular_system, element='group')
group_index = msm.get(molecular_system, element='group', index=True)
plt.scatter(group_index, sasa_per_residue[0])
MOLSYSMT WARNING | UnitStrippedWarning: The unit of the quantity is stripped when downcasting to ndarray.
<matplotlib.collections.PathCollection at 0x75aace633f80>
sasa_per_molecule = msm.physchem.get_sasa(molecular_system, element='molecule')
sasa_per_molecule
| Magnitude | [[96.37336730957031 98.58065795898438]] |
|---|---|
| Units | nanometer2 |